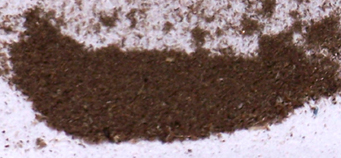
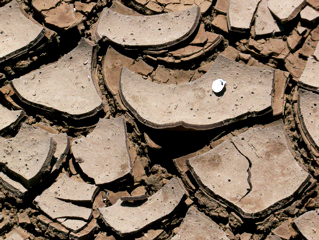 San Luis reservoir bottom, September 2007, when the
fresh water clams could not move fast enough, to keep up with
the rapidly draining water levels. Copyright ©
2007 by Craig Dremann.
San Luis reservoir bottom, September 2007, when the
fresh water clams could not move fast enough, to keep up with
the rapidly draining water levels. Copyright ©
2007 by Craig Dremann.DOWNLOAD a movie, showing the clouds
of China dust hitting California.
by Craig C. Dremann, Box 361, Redwood City, CA 94064 (650)
325-7333
Text and photos copyright © 2007-2010 by Craig & Sue
Dremann,
all rights reserved including the web. Use of photos or text requires
a license.
San Luis reservoir bottom, September 2007, when the
fresh water clams could not move fast enough, to keep up with
the rapidly draining water levels. Copyright ©
2007 by Craig Dremann.
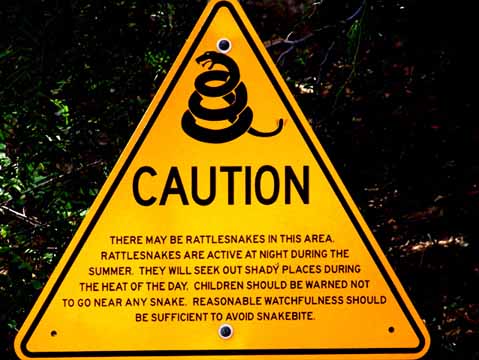
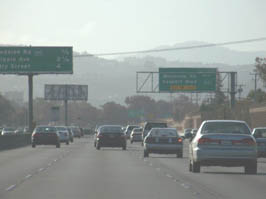
The drought is forcing wildlife, including rattelsnakes, to
move towards irrigated areas, like lawns and rest stops. Photo
of sign posted in Santa Barbara County at US Highway 101 rest
stop.
UPDATE May 2012
Proposed drought
maps, 2006-2009 >>see here
...Ooooh----that map does not
look too good for California, does it? Looks a little droughty?
---Looks like we are experiencing some
of that climate change that the US has been avoiding doing anything
about?
.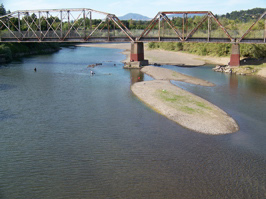 Russian River, May 31, 2009 at Headsburg,
California, from the Healdsburg Ave. bridge looking upstream
at the railraod bridge and the low river flow and sand bars.
Russian River, May 31, 2009 at Headsburg,
California, from the Healdsburg Ave. bridge looking upstream
at the railraod bridge and the low river flow and sand bars.
Written to the DM authors on March 7, 2010: "UC BERK &
NOAA sci.and wild oats confirming Cal.drought measurements."
According to the wild oat (Avena fatua) already setting seeds, which are the exotic annual grass covering most of low-elevation California below 1,000 meters, we have reached the max. rainfall for the season in Palo Alto.
These plants are suggesting that for Palo Alto, for the rest of this spring, less than 0.25 inch of rain will fall between today and June 30.
Perhaps this little plant, as an environmental and sensitive moisture indicator itself, is suggesting that perhaps we humans need to add some other indicators when measuring a multi-year drought in California, in addition to the snow pack survey and the rain gauges?
For normal measurements of the snow pack and the rain gauges, we may appear to be close to normal, but the streamflows like at Palo Alto, are indicating that the runoff from the watersheds between rainfall events, we are still way below normal mean, because there has not been enough consistent rainfall and high enough humidity over time.
When you look at 70 years worth of flow data, the stream in Palo Alto has been dropping very quickly after each scattered rain event. A while ago, I was also mentioning in another of my many emails, about another change, that will impact how we measure drought in California, when an inch of rain is no longer an inch of rain, according to the environment.
For the last 35 years, for our commercial seed storage aspect of our business, we keep close track of the daily relative humidity. Prior to the current drought, the winter relative humidity would normally settle between rainy periods, at about 60%, never dropping below 50% and never ever dropping into the 40s or 30s.
Since this California drought started, the whole winter has been drier at times, than the Arabian desert, bouncing between 40 and 48%. What that means is that an inch of rain in a rain gauge, has a different effect when it enters an ecosystem or watershed when the daily RH has become 30% drier?
It is as if California is a patient in a hospital, and needs a certain number of pints of transfusion each year to stay alive. But something changes in the body to get rid of the fluid at a more rapid rate, lets say, 1/3 quicker? Then to keep the patient stable, the infusion rate needs to be increased to 1.33%
What I have been measuring here in Palo Alto, is being confirmed by Univ. of Cal. Berkeley and NOAA scientists, reported this week: James A. Johnstone regarding less fog annually for the redwood trees, and Susan Solomon in the journal Science, that there has been a 10% drop in water vapor in the lower atmosphere over the last 10 years.
The rate that Dr. Solomon measured, exactly
extrapolates out to what I have been measuring in Palo Alto, a
10% drop each decade, for the last 30 years.
Written to the DM authors on February 15, 2010: Any predictive value of Wild Oats for Ca. rainfall?
California botanists and ecologists are this
month, experiencing something
that they probably could never have conceived of happening, the
wild oats
fully ripening on Valentines Day, instead of Income Tax day.
Like clockwork each spring, the annual wild
oats grow and ripen from
Income Tax day to May 1st. When they ripened in Mid-March two
years ago,
I thought it was so remarkable, that I photographed them, because
I felt
that they were indicating a dramatic and sudden end of the rainy
season.
Or let's say, that as an annual plant, it was
hedging its bet, that if it
did not make seed immediately, there was not going to be enough
future
rainfall to make seed, and it better stop leaf growth immediately
and get
into gear for seed production.
I do not know what impact this will be on the
5,500,000 head of cattle,
and the 1,780,000 cows and the 600,000 sheep in California that
depend
each year on these annual exotic grasses to grow and mature at
the same
time each year, but it may be significant.
Also, that means that the 22 million acres
surrounding our major cities,
the part of California covered by these annual weed grasses, will
cause
the fire season to arrive about two months earlier, during a year
when the
State is broke, broke, broke. I hope that the State is budgeting
for at
least a 10% increase in the period that the fire season will occur?
>From an ecological and weather perspective,
it will be interesting to see
if these little wild oats can actually predict the future rainfall
amounts
in spring that closely?
I would be very interested to hear what the
climatologists predictions are
for rainfall in the Palo Alto area, from today to July 1. The
wild oats
are still indicating from less than an inch to a max. of 2.32".
Any
computer models with any guesses, or anyone want to put out a
number?
Perhaps the State needs to start negotiating
with the Feds and the
Westlands water district and the Colusa water district rice farmers,
to
retire their land, so their water can be used elsewhere?
That is what the Feds. did 10 years ago in
the San Joaquin valley with the
Alpaugh water district so that the Friant dam water could be used
elsewhere.
By the way, today is April 22 of the Palo Alto
water year, according to
today's stream flow when compared to the 70-year mean.
Written June 22, 2009 to the DM Authors: Weekly DM map
needs life-and-death benchmarks built in, otherwise political
softballing can occur.
I am still suggesting that the weekly DM map needs life-and-death benchmarks built into the D-4 level, to maintain its scientific integrity, and build a firewall against future political manipulation, that is most likely to occur, or maybe already occurring, on the California and Arizona portion of the Weekly DM map.
California is the best example of this immediate need for science to connect the DM map and existing weekly drought conditions with on-the-ground impacts like fish extinctions.
The sole use of percentiles and reservoir levels
is completely arbitrary, and is especially bad science, without
any scientific connections with reality. Then, the D-levels can
be politically manipulated to softball the dire and life-and-death
impacts of the drought, like our California fish
species on the edge of extinction.
I am hoping that the DM authors want to produce a weekly science-based product, that shows the real on-the-ground, or in-the-rivers levels of drought, rather than producing a softballed, arbitrary, political product?
------------------
Congress Narrowly Defeats Nunes Salmon Extinction Amendment
by Dan Bacher, editor of the FishSniffer, https://www.calsport.org/6-21-09a.htm
June 21, 2009
The Nunes amendment to HR 2847, a measure that
would have removed
funding for court-mandated protections for Central Valley salmon,
was
defeated in a close vote of 208 ayes to 218 nos in Congress on
June 19.
Over 40 Democrats voted for the amendment
despite the probable
extinction of salmon runs, green sturgeon and the southern resident
population of killer whales if the recently released federal biological
opinion was not funded, reported Jerry Neuburger of the California
Sportfishing Protection Alliance. The amendment was strongly supported
by Representatives Jim Costa and Dennis Cardoza, both Central
Valley
Democrats who virtually always side with corporate agribusiness
on
environmental and other issues .
Representatives George Miller (D-Martinez)
and Mike Thompson (D-St.
Helena) spoke at the podium in strong defense of the biological
opinion, stating that passing the amendment would put the entire
process of restoration back at square one and cause several years
delay in any attempt to restore California's collapsed salmon
and
steelhead runs, according to Neuburger.
Representative Devin Nunes (R-Visalia) responded
to the defeat of his
amendment by yet again repeating the "Big Lie" that
the movement to
restore the Delta and Central Valley fish populations is an issue
of
"fish versus people," completely ignoring the thousands
of people
employed in recreational and commercial fishing businesses and
coastal
and Central Valley communities that have been devastated by recent
salmon and Delta fish collapses.
Environmentalists are tripping over themselves
to preserve every
species that crawls, squirms, swims or flys (sic) but they are
content
to let humans die," claimed Nunes. " And now they have
a government
that agrees with them. This Congress and our President have chosen
fish over people in my state."
NMFSs June 6 biological opinion found that
the pumping operations of
the Central Valley Project jeopardize long-term survival of winter
and
spring-run Chinook salmon, green sturgeon, Central Valley steelhead,
and southern resident killer whales. The opinion called for reductions
amounting to only approximately 330,000 acre-feet, or 3 to 5 percent
of
Central Valley and State Water Project water exports.
"The operational impacts on the state
and federal water projects are
vastly underestimated," claimed Costa and Cardoza in a support
letter
for the Nunes amendment. "Additionally, there are substantial
biological assessments that have been performed on the Delta,
but NMFS
has confirmed that these were not taken into account in the biological
opinion."
A broad coalition of recreational fishing groups,
commercial fishing
organizations, environmental organizations and others rallied
against
the last minute Nunes amendment and, at least for the time being,
stopped Westlands Water District and their collaborators in Congress
from making sure that salmon, green sturgeon and killer whales
go
extinct. Representatives George Miller and Mike Thompson deserve
kudos
for the leadership role they played in defeating the amendment.
Expect Westlands Water District and corporate
agribusiness to launch
more attacks on the biological opinion in the coming weeks and
months.
On the same day the amendment was defeated,
Governor Arnold
Schwarzenegger amped up his war on fish and campaign to construct
a
peripheral canal and more dams at a meeting and press conference
with
local officials in Mendota to discuss the statewide "drought"
and its
effects on the region. True to his role as the "Fish Terminator,"
Schwarzenegger blasted the biological opinion, parrotting the
"Big
Lie" of "fish versus people" that Nunes and agribusiness
keep
repeating.
I think the judges decision is wrong,"
claimed Schwarzenegger. "If you
start choosing species, and the smelt and salmon over people,
I think
you are wrong. I think its a mistake when you see the impacts
that it
has."
Written June 6, 2009 to the DM Authors: Cal. examples of watersheds & huge drought impacts
on fish, from https://www.nwr.noaa.gov
You can see what the huge drought impact has been on California
fisheries, when you look at all the fish populations that have
been Listed as either Threatened or Endangered, for example: The
Chinook salmon
--Sacramento River winter run, Endangered
--Central valley spring run, Threatened
--California coastal, Threatened
Coho salmon, listed in all of California habitats that it is found in.
--Central Cal. coast, Endangered
--Northern California coast, Threatened
Steelhead
--Southern California, Endangered
--South-central California coast, Threatened
--Central California coast, Threatened
--Northern California, Threatened
--California central valley, Threatened
These maps of Listed fish populations correspond closely to my suggest D-4 levels on my map at https://www.ecoseeds.com/caldrought.html
Perhaps the easiest way to map California on the weekly DM map, is as long as these fish are listed, then their watersheds are in D-4 until they recover?
Written June 6, 2009 to the DM Authors: California fish suggesting different measures for D-levels.
SF Chronicle, front page Friday June 5, 2009, <Fishery plan would aid salmon but cut water for humans> by Kelly Zito.
I have been suggesting for months, that river flows be factored in as part of the California D-levels, and the fish are now legally adding the water temp. as a factor also.
Since the fish now get first dibbies on the California snow pack and river flows, maybe the easiest way to map the weekly DM map, would be to set the whole of California as D-4 until the salmon and Delta smelt populations recover, and get taken off the Endangered Species list?
Written May 20, 2009 to the DM Authors: Russian River, Salinas valley & W. Fresno County really need D-4
Today at the Hopland Russian River temp. gauge just hit 19.6 deg. C. which is the close to the max. water temp. that our poor listed Endangered California salmonids can take.
IS THE STATE OF CAL. monitoring these river temps. and recommending that we put D-4 on the weekly map, when we get close to the fish-kill temps and the rivers are about to go to the rocks with low flows?
Also the flow at Hopland is only 1.25 feet deep in May, a flow that we would not be seen during the year, even at the end of summer.
Also, the gauge at Spreckels on the Salinas river is stuck at zero, and I expect that the river will slowly go to zero upstream as summer progresses.
Also, western Fresno county in the Westland district, is rather quickly becoming the 2009 dust bowl for California and the nation.
I saw the blowing dust in March, not coming off the already plowed and unplanted fields, but coming off the fields with dead crops from this winter, the thousands of acres of dryland crops that had died from the drought.
Can we please start showing these D-4 conditions on the weekly DM map?
I thought the overall concept of the weekly DM map, was to show D-4 conditions while they are happening, not after the areas become depopulated from the drought?
Written May 20, 2009 to the DM Authors: CA. drought creating ghost town, SJ Merc. News
San Jose Merc. News, Sunday May 17, Special Section, Manage our water, Page 4--Farmers' Plight - With little water coming, small town faces extinction - When fields are dry, Firebaugh suffers. By Ken McLaughlin. Article talks about the town of Firebaugh becoming a ghost town.
This article confirms what I wrote to the DM authors on May 9, that Firebaugh and other towns in California are threatened by the drought impact, to become ghost towns.
My list of potential new ghost towns on May 9th included Firebaugh, Mendota, Cantua Creek, Three Rocks (already a partial ghost town), Five Points and Huron.
I really think that the DM authors need to make a new drought impact for the weekly map, of GT for ghost towns, created by drought.
Perhaps this new drought impact might eventually get noted on the weekly DM map, when ultra-wealthy Caucasians have to abandon their multi-million dollar mansions in Carmel or Malibu Canyon, instead of poor farm workers abandoning their shacks because of the drought?
Written May 11, 2009 to the DM Authors: Isolated trees with crown fires in Cal. as symptom of D-4 drought.
Thanks for your email, and your investigation about what I am suggesting about crown fires.
What I am suggesting, is talking to ecologists, botanists, or even fire fighters who put out wildland fires--not weather fire forecasters--about what the isolated tree crown fires are trying to tell us about the D-4 conditions here in California.
Sure unusual record temp. weather and winds
can cause those fires, but what I am suggesting, is the D-4 conditions,
like what I map at
https://www.ecoseeds.com/caldrought.html
Even in unusual conditions, crown fires require what is called ladder-fuels, which help spread the fires into the crowns.
But with our current California D-4 conditions, the trees and shrubs are already so dried out, that out of control crown fires in isolated trees, may be our best symptom of the D-4 drought within the California ecosystems themselves.
My wife and I got to hear Dr. E. O. Wilson speak yesterday in Palo Alto.
Dr. Wilson told a funny story about the 1952 science fiction film Red Planet Mars, where a space ship went to Mars, and they landed. One guy looks out the port hole, and sees vegetation, and the other guy asks--What do you see? He replies---There is no life!
That is how I feel every week, when I do not see any D-4 drought in central and southern California on the DM map. There is no D-4 drought?
Our California D-4 drought, south the San Jose/Fresno line, might not be apparent for a couple of reasons, perhaps it is not showing up in the places that weather people might be looking for drought, hidden in the stream flows and trees and shrubs?
When I see only 0.5 inch of annual rainfall
in the whole I-5 corridor from Stanislaus county to Kern County,
and thousands of acres of dead wheat seedlings only a few inches
tall, plus dust storms, and ghost towns forming, and isolated
trees bursting into crown fires because they are so dry---any
reasonable person might conclude that we are already in D-4 in
those areas?
Written May 9, 2009 to the DM Authors: California
D-4 drought in San Francisco Chonicle.
San Francisco Chronicle May 9, front page, by Peter Fimrite: Wildfires, A recipe for disaster--Drought, invasive weeds, warming put much of the state at risk, experts say.
The article says almost word-for-word, what I wrote just two days ago to the DM authors.
My drought-impacted, potential California ghost
town list is increasing, and I hope that the California State
Dept. of Emergency Services can offer assistance for those families---to
move and relocate when they have to abandon those western Fresno
County towns--like Firebaugh and Mendota, as well as Cantua Creek,
Three Rocks (already a partial ghost town), Five Points and Huron.
Written May 7, 2009 to the DM Authors: California D-4 drought going to start expressing itself.
The focus of the California portion of the weekly DM map, on the eight Sierran stations, will not pick up the D-3 and D-4 catastrophic realities that are gathering and have been accumulating for three years, in the west sides of the Sacramento and San Joaquin valleys, plus in the Coast Range mountains from the Oregon border to the Mexican border, where the bulk of the human population lives in California.
Trying to draw the California D-levels from outside of California, or from a Sacramento perspective, is maybe an impossible task, because you miss the on-the-ground indicators from the ecosystems that are screaming D-3 and D-4 conditions, that are impossible to ignore if you are living amongst them.
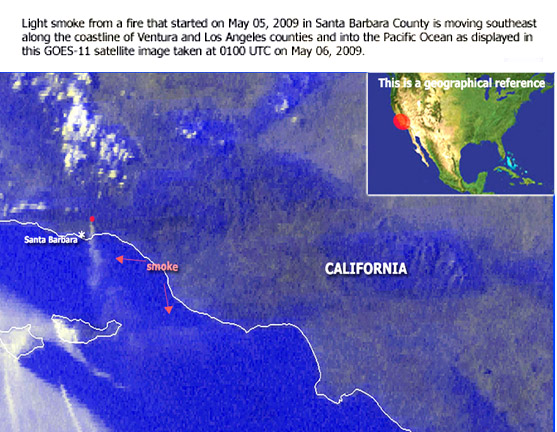
How the D-3 and D-4 conditions will express themselves, is out of control crown fires, starting today. When you see the scenes of the California fires this year, like the Santa Barbara fire today, watch for whole [isolated] trees on fire--that is a crown fire.
The weather people in California contributing to the D-levels in California could contact the California Department of Forestry, and the NOAA people could contact some foresters at the US Forest Service, and confirm what I am suggesting, about the relationship between D-4 and out of control crown fires [in isolated trees].
What that means, is when you get D-4 conditions, the trees and shrubs have so little moisture in them, that they burn like they are made of gasoline, and burn fiercely from ground level to the top, or the crown.
I saw what happened last year at the Porter Ranch fire in Los Angeles County.
I have seen a lot of fires in California, but that D-4 fire really took the cake. The fire was stopped right before it hit a new subdivision of homes nestled against the shrub-covered hillside, that you can see at https://www.ecoseeds.com/porter_fire_end.jpg
However, there were so many live embers in the wind, that the embers blew over the houses 500 feet and got caught by a line of planted, irrigated shrubs at the city park, and they burned like you put a blow-torch on them, that you can see at https://www.ecoseeds.com/toasted_shrubs_porter.jpg
Hyperarid is defined as 10 inches of rainfall or less, per year.
What I saw along I-5 from Stanislaus County to Kern County this year, was hyper-hyper-aridity, with only 0.5" total rain, falling along that corridor, thousands of acres of dryland wheat dead, and zero vegetation growing on the hills.
When a forest or shrub ecosystem, that is used to 20-40 inches a year, gets a lot less, especially over a three year period, that drought stress is going to multiply and accumulate over time, and eventually be expressed in uncontrolled crown fires.
Add to the three years of D-3 and D-4 drought, when 150 years ago, the newcomers to California stripped off all of the 140,000 square miles of fire-resistant perennial bunchgrass understory that stayed green all summer, the vegetation that controlled fires by not offering much burnable biomass per acre.
Then we added 1/2 million sheep, 1.7 million cows, and 5.5 million cattle, and substituted for the fire-resistant native perennial bunchgrasses, the annual European grasses, whose fuel load, burns equal to 500-1,000 gallons of gasoline per acre --then you have the makings of a catastrophic summer of 2009.
Written May 1 2009 to the DM Authors: California rivers telling different story about the D-3 and D-4 drought.
I read with some concern, the suggested [DM author's] D-levels for California.
The totals for the snowfall in the Sierras, if normal or close to normal is fine for the cities and they should not notice the drought, and it could be set at D-0 or D-1 for the impact they may feel this summer.
However, even that Sierran snowfall apparently is not enough, when one of the largest ag. water districts in the USA, the 600,000 acres of Westlands in Fresno County, is only receiving 10% of normal irrigation water, and all of its thousands of acres of dryland wheat are dead, only growing a few inches tall.
Thousands of acres of dead wheat, like what I show at https://www.ecoseeds.com/wheatdead_closeup.JPG are what lawyers call, primae facie evidence, that at least for that portion of California, we have a D-4 drought.
Anyone working for CDFA or USDA, who would look at that picture, and if you asked them what level of drought killed that wheat, they would have to say D-4 or they were herbicided right after they germinated, because only a D-4 could be so devastating.
I would be very interested if either the NOAA or the DWR authors, had my wheat picture looked at by any ag. person at CDFA or USDA, and asked them, in their opinion what D-level caused that wheat kill?
What I suggested in a previous email a few months ago, that after three years of drought, the ecosystems and watersheds outside of the Sierras, are not registering an inch of rainfall as an inch of rainfall.
The only thing that matters after three years, is the ecosystem interpretation of that inch of rainfall. Does that inch circulate back into the system as normal, or do abnormally and record low river flows start showing up?
So all of the old percentiles should be thrown out or re-evaluated to accurately measure this California drought in its third and future years, and on a weekly basis, see what percentage of mean is each river flowing?
And then, base the D-levels on the percentage of mean flow in cu. ft/second for that week for the DM map, for each watershed.
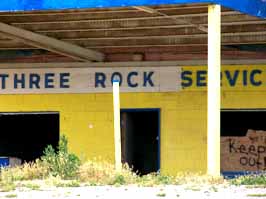 Ghost towns forming. Western
Fresno county in the north end of Westland water district, the
town of Three Rocks becoming a ghost town. Town was named for
the three sandstone rock peaks that can be seen from the town,
on the western coast range horizon. Photo April 24, 2009 by Craig
Dremann.
Ghost towns forming. Western
Fresno county in the north end of Westland water district, the
town of Three Rocks becoming a ghost town. Town was named for
the three sandstone rock peaks that can be seen from the town,
on the western coast range horizon. Photo April 24, 2009 by Craig
Dremann.
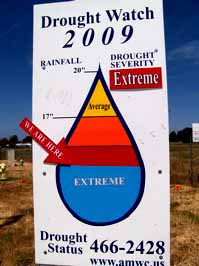 Extreme drought in upper Salinas
river watershed, drought status April 2009, "You are here-->
EXTREME." Photo April 27, 2009 by Craig Dremann.
Extreme drought in upper Salinas
river watershed, drought status April 2009, "You are here-->
EXTREME." Photo April 27, 2009 by Craig Dremann.
Written April 27, 2009 to the DM Authors: Westlands (Fresno County), Salinas River and Russian River valley.
Just came back from visiting the Westlands water district (Fresno Co.), upper Salinas river valley, and have been watching the river flows on the Russian River on the USGS site at https://waterdata.usgs.gov/ca/nwis/rt
The DM map authors, really need to consider making up a new GT drought impact, or Ghost Town impact, because we saw the potential of ghost towns being created by this long-term California drought.
I think everyone would agree, that Ghost towns are probably the most dramatic drought impact that anyone can easily see.
When you see permanently abandoned buildings, towns that died from lack of water, I cannot think of a more awesome drought impact, because it means that drought made a number of people to have to permanently abandon that area.
Ghost towns as an Exceptional Drought impact in California, could be in the process of forming by the end of summer, in certain areas of the State:
1.) Drought causes water to be shut off, diverted, or restricted within water districts, and people lose their jobs when crops not planted, and abandon their homes.
Or drought kills crops already planted, like the thousands of acres of dryland wheat, that were losses in the Westland district in Fresno county this spring.
Isolated agricultural communities, like Three Rocks or Cantua Creek in Fresno County , or Hinkley in San Bernardino County, have the potential to rapidly turn into Ghost Towns---when the agricultural jobs dry up, people have to move to find new jobs, and nobody is available to buy their homes.
2.) Drought impacts on public ground water supplies, when depleted due to long-term drought, like the public wells of the upper Salinas river watershed, has the potential to run dry before the end of summer, causing ghost towns.
3.) Drought impacts on private ground water supplies, when depleted due to long-term drought, can create ghost towns.
4.) Drought impacts on surface-water supplies, if they dry out in summer, before the new rainfall season. This year, the Russian river watershed and perhaps other NW Californian rivers and the watersheds, have the potential of drying out this summer.
The watersheds in Marin County already dried
up once, in 1977, and the towns of Marin County were only saved
by building an emergency water line across the Richmond bridge.
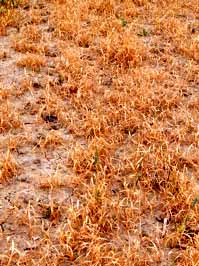 Thousands of acres of dryland winter wheat
killed as seedlings by 2008-2009 drought in western Fresno
County, in the Westlands water district. Photo April 24, 2009
by Craig Dremann
Thousands of acres of dryland winter wheat
killed as seedlings by 2008-2009 drought in western Fresno
County, in the Westlands water district. Photo April 24, 2009
by Craig Dremann
Written April 17, 2009 to the DM Authors: New California
ghost towns, may show up in Fresno County first.
The first new California ghost towns
in 2009, may show up in the Westland water district area, that
got its water shut off this spring, in Fresno County.
There are three towns that are the most vulnerable: Five points, Cantua Creek and Huron.
I cannot get information about Five Points, but Cantua Creek is 655 people with 155 housing units, and Huron is 6,306 people in 1,414 housing units.
When I visited the Mojave desert, I saw newly abandoned ghost towns forming on the western outskits of Barstow, in the town of Hinkley, but that may or may not be drought induced. In one case, the ornamental lawn pieces were still in the front yard, and the door wide open, and the windows already broken out.
Some of the wealthiest Californian communities, that do not have any underground aquifers or adequate wells to draw on, may eventually be vulnerable to the long-term drought impact of becoming ghost-towns, like Los Altos Hills, Beverly Hills, Palos Verdes and Palos Verdes Estates, Portola Valley, most of the cities and towns in Marin County, etc.
If we start to show the Californian D-3 and D-4 drought on the weekly DM map, that is now covering California this month, then the wealthier communities might have a chance, to start investing in drilling sufficient local wells and preparing adequate local water supplies for a longer-term drought, so they will not need to abandon their mansions in the future.
Written April 10, 2009
to the DM Authors: California is in permanent drought, according
to Websters and DWR.
The problem with the weekly DM map and drought, is that you are suggesting using the first definition in Webster's (Seventh New Collegiate) and I am suggesting using the second definition for the word drought.
The first definition is a prolonged period of dryness. That can be measured by comparing the current conditions with normal reservoir levels, normal rainfall totals, etc., and mapped accordingly.
What I am suggesting, as does the California Department of Water Resources (DWR) report---that even with a normal rainfall year of precipitation, in California there is a drought according to the second definition, which is---a prolonged or chronic shortage.
I like that chronic shortage definition of drought, because it matches California exactly, and has been confirmed by the DWR---that even if we get normal rainfall, we are still have a chronic shortage.
That chronic shortage is going to ripple though the system in normal years, maybe unnoticed except by the farmers, and the fish populations are going to continue to suffer, which required them to be listed as Endangered species in the first place.
So during normal rainfall year, would be a D-3 Statewide in California, when only the fish and a few farmers are suffering from the chronic shortage.
But during any below normal rainfall, can you imagine what a 5.1 million acre feet deficit to the farmers and the 30 million people, meant a decade ago?
Now we have 38 million, and the fish populations are crashing, and the ecosystems are showing unique signs of unusual stress, like the evergreen Quercus agrifolia oaks losing their leaves in January, and the Arabian Empty-Quarter-like low RH in spring, like 22% the other day, and the massive wildfires every summer burning more acres, for a longer period of time.
I am suggesting that the weekly DM map has to account for the California reality, that several decades ago, maybe in the early 1970s, California crossed over the threshold into permanent drought---severe in normal years, and exceptionally severe in years with below normal rainfall.
What that means, is that in years we receive normal rainfall, that rainfall unfortunately puts us into a drought situation, because all the water during a normal rainfall year, has been oversubscribed, as the DWR report is stating.
To have no drought showing on the California portion of the weekly DM map at this point, you would have to have at least 125% of normal every month during the rainy season, October to April, to be normal any more, to get us though the summer each year, between rainfall periods.
Written April 10, 2009 to the DM Authors: California has been in permanent drought for a while now.
What I am suggesting about the Endangered fish populations crashing, is that they are another symptom that we have a D-4 drought here in the State.
They are a symptom, just like the wind-whipped wildfires in Texas and Oklahoma yesterday, are a symptom of a very severe degree of drought out there.
That California is in a permanent state of drought, was published in a report by the California Department of Water Resources, over a decade ago, confirms what Richard and Brett were discussing in their emails this morning.
You can download the PDF file that talks about California being in permanent drought, the 1999 testimony from Don Bransford, chairman of the Northern California Water Association.from https://www.ecoseeds.com/ca_water_shortage.pdf
The testimony states, that according to DWR Bulletin 160-98, California statewide water demand currently [in 1999] exceeds supplies by 1.6 million acre feet in average water years, and in drought, the supply deficit is 5.1 million acre feet.
So during good or normal rainfall years, California should be shown as D-3 on thew weekly DM map and during exceptional drought years like right now, the whole state should be D-4, according to the DWR report?
I think the weekly DM map should start reflecting what our own California State Depratment of Resources is indicating in their report---that we should be shown on the weekly DM map in permanent drought in good rainfall years, and in severe to exceptional drought on the weekly DM map, during any years where we get anything less that normal average rainfall.
Written April 9, 2009
to the DM Authors: 70% of California salmon populations vote
for D-4 for weekly map
SF Chronicle Thursday April 9 page 1, Salmon season doomed, feds say.
This is a case where 70% of the salmon population is voting absentee, for D-4 for the California watersheds that they normally breed in.
That means all the major rivers---the Klamath, the Trinity, the Sacramento and the San Joaquin.
The article talks about the San Joaquin in the past, where the fish were so plentiful that you could reach in and pluck a fish right out of the water.
When California is in the process of losing
a multi-million dollar natural resource during an exceptional
drought, and if the weekly DM authors are still relying on percentiles
and reservoir levels to tell you how extremely severe the drought
is, you are ignoring the realities that the rivers and Endangered
fish are trying to tell you
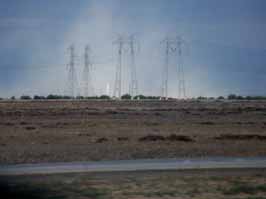
Dust storms April 2009 in Kern County, photo by Craig Dremann.
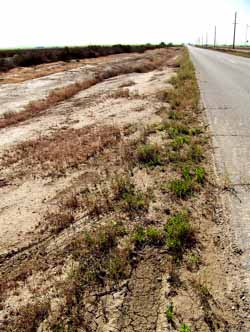 Kern County
roadside between I-5 and the Kern River, north of town of Lost
Hills, only got a 1/2 inch of total annual rainfall, so the
only plants that grew, where from the road run-off, only growing
along the road within two feet of the road edge, and the road
runoff did not even hit the ditch only two feet away.
Kern County
roadside between I-5 and the Kern River, north of town of Lost
Hills, only got a 1/2 inch of total annual rainfall, so the
only plants that grew, where from the road run-off, only growing
along the road within two feet of the road edge, and the road
runoff did not even hit the ditch only two feet away.
Written April 6, 2009 to the DM Authors: San Joaquin and Salinas river valley dust storms, only one symptom
On a short-term climate basis, and from an agricultural perspective, the two dust storms that I drove through a week ago, may only appear to be fields freshly plowed, being hit by 15-25 mph winds, with gusts to 35-40 mph.
But that perspective is like a person with a raging internal infection, and there is a skin rash present, and everything may seem to be better if we put some skin cream on it, without looking at the problem of the underlying infection.
I have been annually monitoring several ecosystem plots for more than a decade, around California: San Mateo County at Russian Ridge, two plots in Kern County--one in the San Joaquin valley due north of the town of Lost Hills and the other near Kramer Junction, and the Palo Alto creek arroyo at the University Ave. bridge.
If this current California drought become permanent, like it did in Australia, it might be important to record the changes to the various ecosystems, at least for the historic record.
What I saw in the area of the San Joaquin valley dust storms, that troubled me, was not watching the most valuable California topsoil getting airborne, plus the bad air quality that airborne silica creates.
Or the fact that any soil scientist or ecologist might say, that seeing your topsoil getting airborne, could be a sign that your civilization is potentially shortening its future survival?
None of those things bothered me as much as seeing what happened this year, ten miles north of the town of Lost Hills.
That area along I-5, from the Grapevine to Los Banos, is normally the lowest rainfall area of the San Joaquin valley, is in the rain shadow of the Coast range, at 8-10 total inches of rainfall area. This low rainfall strip is only a couple of miles wide following I-5, and I call this area the Tongue of the Mojave, because it is like a long tongue of the Mojave licking northward from the Tehachapis.
What really bothered me, was that only 0.5 inch of rain had fallen in that area for the whole rainfall year, and my notes say:
---The only plants grew, where from the road run-off, only growing along the road within two feet of the road edge, and the road runoff did not even hit the ditch only two feet away---
Also, where the dust storm hit us in the Salinas
valley, my notes say:
---Salinas river between San Miguel and Paso Robles, dry to the
sand. And Solidad, only got 8-10 inches of rainfall, based on
height of exotic grasses, and did not see a drop of water in the
river---
I see the dust storms as only one symptom of the D-4 drought that I saw in the Salinas valley and in parts of the San Joaquin valley. And my normally evergreen oaks, the Quercus agrifolia in the SF Bay area, are still shedding leaves, when they should not be shedding any this time of year, ever.
What is very interesting to me, is the possibility of farmers getting arrested, for drawing down the rivers to the point that the Endangered fish get killed. That is the first time, I ever heard of a drought getting farmers arrested.
What are we going to do this summer, if there are more water rustlers? Hangem high for water rustling? Will the DM authors have to add prison bars to the weekly map, a new drought impact, jail for water rustling?
The land, the rivers and the rangelands are trying to tell us the true story of the exceptional and extreme nature of this drought, and it is much, much worse than all the percentiles, snowpack measurements and major reservoir levels, that have been used to far to characterize its severity so far.
Written April 5, 2009
to the DM authors: Coho Killed After
Water Diverted To Protect Crops
The Russian River at Healdsburg, the river is only flowing at 16% of mean for this date, and the Russian River watershed today is obviously at D-4 levels, because the farmers are causing fish kills of the Listed Endangered Coho salmon, and are liable to be arrested.
Coho Killed After Water Diverted To Protect Crops
The Associated Press
April 4, 2009
HEALDSBURG - Officials say endangered coho salmon were killed after a sudden drop in the water level of a Russian River tributary this week due to the siphoning of water used to protect crops from frost damage.
The fish deaths come as a multi-agency task force is set to meet on Tuesday in Sacramento, where officials will discuss how to protect crops from the cold without threatening fish in the Russian River system.
Dan Torquemada of the National Marine Fisheries Service says his agency, the state attorney general and the Sonoma County district attorney are all investigating this week's fish kills.
Last year another fish kill occurred, prompting Tuesday's meeting.
The fish die when farmers pump water for frost protection, causing water levels in the Russian River and some of its tributaries to fall dramatically, stranding the fish.
------------
Along with the A and H impacts that are already shown on the
weekly DM map, I am hoping that the DM authors will add the following:
--GT for Ghost towns are are created by the droughts, and,
--DS for the future dust storms, plus,
--FA for farmers arrested for killing Endangered fish when the
farmers suck all the water out of the exceptionally low rivers.
Written March 25, 2009 to the DM authors: California does not need to
have ghost towns, if get honest with drought now.
I am suggesting that we look at what
has happened to Australia [National Geographic, April 2009, "Australia
Goes Dry"], and see if there were anything that the Australian
government did, by soft-balling their drought early on, that caused
major problems later, including the making of ghost towns.
The severity of the state-wide California 2006-2009 drought, especially in the oak woodland ecosystems, in the coast ranges, and on the west side of the Great Valley, has not been accurately shown on the weekly DM map for several years now.
And the down side, is when areas like Marin County, the Russian River, the Salinas valley, look at the weekly DM map, they do not see the severity of the drought, and the map paints the picture that it is not that bad.
The rivers and streams in central and southern California should not be drying up to the rocks on March 25th, or on January 1st, or on February 1st, like what I have been watching in Central California this spring. And the Quercus agrifolia oak trees should not be shedding a single leaf in January, let alone whole forests full.
If you travel north of Twentynine Palms in San Bernardino County along the road to Amboy crater, you can see a modern ghost town, not from the 1800s but from the last decade or so.
Ghost towns can happen very quickly, especially
if water supplies
disappear or are shut off to an area, and a lot of California
not hooked up to the snowpack runoff water supply, could turn
into ghost towns. And it would not take a D-4 to do so, but a
long-term, but seemingly minor drought, could do the same thing.
New ghost towns in California do not need to be a future reality, if we could just be more honest about the exceptional drought we currently have, in places.
Written March 20, 2009 to the DM authors: California going to get huge China dust cloud soon
A new China dust cloud is coming to make all of us Californians, have to wash our cars in a few days. The giant China dust cloud is on the horizon, and the latest NAAPS image attached, and will be hitting us in a few days.
I keep mentioning the China dust, and that it might be the possible cause for the current California drought, after comparing the GONU category 5 storm in June 2007 that was stopped by the Asian dust cloud, unable to make landfall. Images at https://www.ecoseeds.com/Saudi.html.
When have you ever seen, such a staggeringly huge Category 5 storm, not make landfall if it is headed directly for land? The dust kept it bottled up in the Straits of Hormuz next to Oman, for days, like a bottle in a cork, and it took a couple of days to dissipate there.
If the Asian dust is able to repel and steer
a massive, powerful Category 5 storm, what could it be doing to
steer, repel or jostle our wimpy California rain clouds that we
so desperately need, every winter and spring?
Written March 19, 2009 to the DM authors: California drought, directly related to China dust cloud?
I was chatting with the Univ. of Wisconsin Madison researcher who sent me the China-dust-cloud-hitting-California picture last year.
He suggested, if you go to https://www.nrlmry.navy.mil/aerosol/
and in the upper frame, hit "The Big Table" and then
hit the link to NAAPS Current, World, you come up with a picture
of a huge China dust cloud coming to get us in California, attached.
When you match that image, with the current
world cloud pictures from Univ. of Wisconsin at https://www.ssec.wisc.edu/data/comp/latest_cmoll.gif
and match the dust cloud with the areas that are barren of rain
clouds, the image is striking, attached.
It appears that the least amount of dust in the atmosphere that the NAAPS project images, which is only 0.1 ugm/m3, is sufficient to knock out rain clouds worldwide, like the most efficient football player blocking the storms.
My concern is, that we are still focused on hoping for winter and spring rainstorms, that may be permanently disrupted or partially or totally blocked, especially in spring, from the China dust storm effect.
If my hypothesis is correct, about the huge impact that the China dust cloud is making on the California water supply, then all bets are off on what is going to be our new <normal> but lower, water supply.
Also, it has been predicted that global warming
will eventually make a big negative impact on the California water
supply within the next few decades, but it is my opinion, that
we are already seeing a permanent and huge impact, caused directly
by the China dust storms.
Written March 9, 2009 to the DM authors: China dust storm hit San Francisco,
and the continued three-year drought makes wild oat grasses set
seed 5-8 weeks early---
 A cloud of China dust hit the
San Francisco Bay area on the afternoon of Sunday March 8, 2009,
lowering visibilities to 4-7 miles, and cloud continued to hit
to March 18, at https://www.ecoseeds.com/china_dust_RC_3-8-09.JPG
A cloud of China dust hit the
San Francisco Bay area on the afternoon of Sunday March 8, 2009,
lowering visibilities to 4-7 miles, and cloud continued to hit
to March 18, at https://www.ecoseeds.com/china_dust_RC_3-8-09.JPG

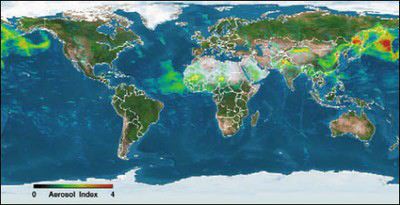
NOAA image of the origins of
the China dust clouds
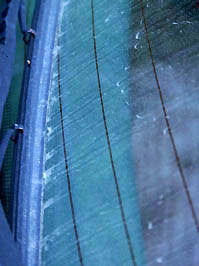
The China dust cloud dropped a layer of particles that you could clearly see in layers on our car windshields and piling against the wiper blades, with a photo of a 24-hour accumulation at https://www.ecoseeds.com/windshield_dust_3-8-09.JPG

Meanwhile, the wild oats and
other exotic annual European weed grasses, that cover 99% of the
lower elevations of the State of California, are hedging their
bets about the possibility of not getting normal rainfall in the
spring of 2009, and were seen setting seed at the end of January,
about two months early.
You can see a photo of the wild oats setting seed early, taken
on March 8, 2009 along the coast California Highway One in Half
Moon Bay at https://www.ecoseeds.com/wild_oats_3-8-09.JPG
Written March 8, 2009 to the DM authors: Dust storms suppressing cloud formation, including Calif?---
I have uploaded onto my server at
https://www.ecoseeds.com/latest_dust3-8-09.gif
[below] a world image, showing an outline of the atmospheric dust
that is currently being picked up by MODIS, and you can see how
the dust concentrations are suppressing cloud formation around
the world, including off the coast of California, with a big slug
of dust just off our coast on Friday.
The dust clouds look like giant blood clots, cutting off the blood supply to California.
Are any of our State climatologists or NOAA people on this list server, making any connections between these China dust storms, and the lack of precipitation here in California when they hit, or keeping track of this potential effect?
If we are going to draw accurate maps of drought for the western States, especially for California, the China/Arabian dust storms that are suppressing cloud formation upstream of the USA, really needs to be factored in, so see if they are a direct and major cause of the droughts in winter and spring in the West.
Also, if the connection is proven, that the dust storms are impacting on California's total rainfall/snowfall, then as long as there are dust storms in winter and spring from the Gobi desert hitting California from China, could California potentially experience permanent drought to one degree or another?

Here is some information about the potential impact of the atmospheric
dust cloud causing extreme droughts on the western edge, in South
America:
https://earthobservatory.nasa.gov/IOTD/view.php?id=37239
More than mere colors on the page, the blotches of brown and cream, with only faint dustings of green, in this image, represent the impact of one of the worst droughts in southern South America in decades. Each tiny dot of brown is a two-kilometer square of land (250 meters per pixel in the large image) where plants were struggling to grow in the hot, dry weather.
Since northern Argentina, Uruguay, and southern Brazil contain rich, intensively cultivated land, the dots include fields of corn, cotton, soy, wheat, or pastureland for grazing cattle. The brown tones reveal that these plants were growing far less vigorously than average in late January 2009.
From mid-November 2008 through mid-February 2009, unusual weather patterns brought extreme temperatures and low rainfall to this normally productive agricultural region. The period is critical for many crops, including cotton, wheat, soy, and corn. As a result, crop yields in the three countries were expected to dip, with Argentina suffering the worst blow, said the U.S. Department of Agriculture Foreign Agricultural Service (FAS). Even Argentinan famous beef industry had been affected by the drought, reported BBC News, as pastureland disappeared, and cattle starved.
Considered individually, many of the brown dots in the image
represent a personal disaster, a farmer facing the prospect of
a poor harvest or a herd of malnourished or dying cattle. As a
whole, the image conveys something of the severity and extent
of the disaster.
In simple terms, the vegetation index is a scale of the amount
of light plants absorb during photosynthesis. By comparing current
vegetation index values with values recorded at the same period
in previous years, scientists can tell how well plants are growing.
While the impact of drought on vegetation is occasionally visible
in photo-like satellite imagery, the vegetation index comparison
is a more precise way to evaluate the impact of drought.
This image, based on observations from the Moderate Resolution
Imaging Spectroradiometer (MODIS) on NASA's Terra satellite, compares
the vegetation index for January 17 and February 1, 2009, to the
average vegetation index during the same period from 2000 through
2008. Brown shows where the current vegetation index is lower
than average, meaning that less photosynthesis was occurring;
cream shows where conditions were average; and the few spots of
green show where the vegetation index was higher than average.
Darker shades of brown stretch from the Pampas grasslands of Argentina
to the croplands in southern Brazil. Severe drought clearly impacted
the entire
region.
References
Foreign Agricultural Service. (2009, February). World Agricultural
Production.
Published in Crop Explorer. United States Department of Agriculture.
Accessed
February 27, 2009.
Piette, C. (2009, February 23). Drought sucks life from Argentina,Äôs
farms. BBC
News. Accessed February 27, 2009.
NASA image created by Jesse Allen, Earth Observatory, using
data provided by Inbal
Reshef, Global Agricultural Monitoring Project. Caption by Holli
Riebeek.
Written to DM authors March 7, 2009: California, parts of Salinas valley missing winter/spring rainfall qualifies as D-4?----
The Salinas valley, which is a huge agricultural
watershed, has been missing all the winter and spring storms this
year, and the gauge about half-way up the river at Bradley is
telling the tale of D-4. The Bradley gauge is downstream from
where a major river, the San Antonio meets the Salinas river at
the Monterey/San Luis Obispo county lines, at Camp Roberts, which
is an old WW2 base.
The middle of March is when the record flows have occurred in
the past, as follows:
LOCATION.--Lat 35°55'49", long 120°52'04"
referenced to North American Datum of 1927, in SW * NW * sec.14,
T.23 S., R.10 E., Monterey County, CA, Hydrologic Unit 18060005,
on left bank, 6 mi northwest of Bradley, 6.9 mi south southeast
from San Ardo, and 7 mi downstream from San Antonio River.
DRAINAGE AREA.--2,535 mi2.
PERIOD OF RECORD.--October 1948 to current year. Monthly
discharge only for some periods, published in WSP 1315-B.
CHEMICAL DATA: Water years 1958, 1962-66, 1972-75, 1977,
1980, 1981.
SEDIMENT DATA: Water years 1950, 1990.
REVISED RECORDS.--WSP 1285: 1950. WDR CA-84-2: 1978.
GAGE.--Water-stage recorder and crest-stage gage. Datum
of gage is 442.69 ft above NGV of 1929 (levels by U.S. Army Corps
of Engineers).
REMARKS.--See schematic diagram of Salinas River Basin
available from the California Water Science Center.
EXTREMES FOR PERIOD OF RECORD.--Maximum discharge, 120,000 ft3/s, Mar. 11, 1995,
gage height, 23.44 ft, from rating curve extended above 50,000
ft3/s; no flow at times in 1951, 1954-55, 1957
The web page for the Bradley gauge has 51 years of records, and
today is only flowing at 49 cu.ft/sec. when the mean is 1,160
and a max. of 14,000 in 1978. The mean flow for March has two
peaks on March 5 and 11th, and we currently have flows 1/2 of
the annual mean minimum lows of mid-December.
I think that at least this part of the Salinas valley qualifies
as D-4 for agriculture and hydrological impacts, not to mention
the poor fisheries--what are they going to have to evolve into
rock-fish to survive in the dry rocks and gravel, by summer?
Written March March 6, 2009 to the DM authors: NOAA climate prediction center, agrees with my maps--
The NOAA climate prediction center maps
agree very closely with my suggested DM maps. I have attached a couple of the current NOAA maps.
Written March 4, 2009 to the DM authors: Monitoring California stream flows, is best measure of ecosystem health---
Unfortunately, if we do not put percentage of long term stream flows in California each week, as a major foundation for drawing the DM map, then we will be turning our backs on the real magnitude of the hydrological, wildlands fires, ecosystem, grazing/rangeland, forestry and fisheries impacts of the droughts here in this state,
The cities and the agricultural impact will lag behind on the DM map, because they can draw on stored or ground water sources.
However, for the forestry, hydrological, wildlands fires, and fisheries impacts on the drought, if the streamflow are not put up front, then our California fisheries and ecosystems will continue to experience collapse and extinction.
We already caused the extinction by grazing, of the California native bunchgrassland ecosystem, whose 300 species originally covered about half of the State, so that it is 99.99% gone by 2009.
Now, in my lifetime, we are working on the extinction of the fisheries, like today, the SF Chronicle page B1, <California: Fishermen brace for new salmon ban> by Peter Fimrite, is saying that the Californian salmon fishery is in <NEAR-COMPLETE RUIN>.
The article states that <Record exports of water from the Sacramento-San Joaquin River Delta coincided with major declines in chinook...>
We Californians are like the Easter Islanders, as we are watching the the stripping off of the buchgrass ecosystem, and now the collapse of our fisheries state-wide, is like watching the Easter Island palm trees be cut down, until there were none.
(See the Jared Diamond book, Collapse: How Societies choose to Fail or Succeed--I hope everyone on this email list has read it cover-to-cover?).
I do not want California to be a new chapter in the Jared Diamond book.
When we do not put the weekly percentage of long term mean stream flows up front, for the California portion of the weekly DM monitor, then only the city and ag. use of water is partially represented, with the fisheries, forestry, ecosystem rangeland/grazing and wildfire impacts left out of the picture.
And without showing the ag. districts have their annual
water shut off, as D-4, then, even the California ag. impacts
are not accurately show on the weekly DM map, either.
Written March 2, 2009 to the DM authors: California rainfall inch, impacts ecosystems less than before?------
Could a 2009 inch of precip., falling in lower-elevation California, be different than a measured inch falling into a rain gauge, in any other part of the country?
Or could the 2009 California lower-elevation inch, make less of an impact on the stream flows, than a California measured inch from the mid-1960s to mid-1970s.
Looking at the current impact of the lower relative humidity between storms, and the much more rapid evaporation, seems to be a subtle but big difference.
My guess is, that compared to an inch of rain that fell in Palo Alto between 1963 and 1973, that the 2009 measured inch, there is a lot of the 2009 inch evaporating before it can get into circulation within the ecosystems.
It is almost like looking at virga, but on the ground instead of in the sky.
For example, since last night, it was drizzling in Palo Alto, with 0.20 inch accumulating by 9AM this morning, and then another 0.22 inch fell on a steady basis until noon.
But the low relative humidity and wind that followed the storm, completely dried out everything within a hour or two, so much so, that you would not have known that 1/2 inch of rain had fallen a few hours earlier.
Using the data from a lower elevation California station, like Palo Alto, and comparing the inches of precip. to the resultant stream flows, from the 1963-1973 and the current flows, I think the DM authors and DWR weather watchers may see what I am observing on the ground.
My guess, just from observations and without crunching any
numbers, is that a 2009 lower elevation California inch, is only
0.78% of a 1963-1973 inch.
Written March 1, 2009 to the DM authors: California water future---
There are many event that can change human history on a short
time scale, like wars, famines, floods, hurricanes, etc. But there
are probably only two events that can depopulate a large area,
or destroy civilizations, on a hundreds to thousands of years
time scale:
1.) RADIOACTIVE material releases, with long half-lives, from a nuclear accident like Chernobyl on April 26, 1986 in the Ukraine and,
2.) DROUGHT, long term, like the 50 year drought between 1130-1180 AD that the Anasazi experienced in the Southwest. Or the disappearance of your water supply, like the collapse of the Great Dam of Marib that had stood for 1,300 years in Yemen, which was breached in the 600s AD and destroyed the Sabaean civilization.
I am still forecasting a severe and permanent drop in California annual rainfall, based on several perimeters:
1.) The staggering amount of atmospheric dust upstream from California in the winter, acting like rainfall and cloud killers for the California rainfall, and,
2.) The lack of the normal low pressure winter storm formations or <commas> in the Gulf of Alaska, plus,
3.) The more frequent winter high pressures above 29.95 inches, the dramatically lower relative humidities between storms, the higher rates of evaporation in winter, plus the higher day and night time temps, therefore,
South of the San Jose-Fresno-Tahoe line, will be experiencing continuous D-4 conditions, probably for the next hundreds to thousands of years.
I have posted the world weather for this week, showing the huge cloud of dust in the atmosphere upstream from where our California clouds should be forming.
Also the very weak <comma> can be seen offshore and the very weak <pineapple express> that was supposed to bring us some rain this week, at https://www.ecoseeds.com/world_weather_3-1-09.gif (below).
We really need our NOAA and State climatologists to get some major funding, to study and get on board the <China dust-train> to see where it is leading our California rainfall patterns, for the 38 million people that depend on a reliable water supply.
Written January 17, 2009 to the Drought Monitor authors: Cal. rainfall not meeting minimum levels for ecosystems?---
I am reporting drought conditions from near Palo Alto, which is half way between San Francisco and San Jose.
If we use the San Jose NOAA data, the 2008-2009 rainy season so far, is only 2.79 inches, when normal to date should be 6.55 inches, with a season normal of 15.08.
The various California terrestrial ecosystems, just like our lawns, require a minimum amount of water, to survive each year:
3-8 inches = deserts of Southern California
8-20 in. = native grasslands, rangelands
16-24 in. = coastal scrub, shrublands, oak woodlands
20-35 inches = oak woodlands, madrone, bay trees
35-70 conifers
70+ = coast redwoods.
The terrestrial listed Endangered species in California, are mostly located in the lower range of the rainfall, mostly below 20 inches.
And of course, the riparian and fish need minimum amounts of
flow, to survive. Apparently the low flows this month, are making
a huge impact on one of the remaining Coho salmon populations
in Marin County as they trying to spawn in Lagunitas creek, according
to a story in the SF Chronicle.
Image generated from https://www.hprcc.unl.edu/maps/current/
Written January 18, 2009 to the Drought
Monitor authors: California
overlay, of 12 mo. precip. & ecosystem needs---
Dear All,
To follow up on the details of what the California ecosystems need annually to thrives, and what they have been getting, I have attached a 12-month rainfall total over the California ecosystems, from HPRCC at https://www.hprcc.unl.edu/maps/current/.
Perhaps, along with a California State Fish & Game fish biologist to advise us on the weekly drought impacts, based on the weekly low river flows, on the listed Endangered fish, a plant ecologist from the State of California might be useful to show the droughts long-term impact?
The different plant ecosystems in California, divide themselves along very sharp minimum annual rainfall lines, which I will call the Ecosystem Minimum Annual Precipitation. (EMAP) lines.
For example, you can see the sharp dividing line between oaks and grasslands/rangelands along Cal. Hwy 152 east of Pacheco Pass at the Cottonwood Recreation Area, above the San Luis reservoir. West of the line you have oaks and east is grasslands.
Each ecosystem in California needs a minimum annual precipitation. in order to survive, like we need a daily amount of vitamins to thrive.
You can see on the attached map, that the coast range oak woodlands from San Francisco to San Diego, with the 12 month rainfall, is degrading that whole ecosystem, not to a grassland level, but stepping down two levels, to a desert level.
The same overlay could be done with the 24 or 36 month precipitation. map, to check what each ecosystem in California is actually getting for its ecosystem minimum annual precipitation. (EMAP)
What it looks like, is that all of the ecosystems are at risk in this drought, but especially those that I have suggested are currently in D-4, the coast range oaks and western central valley grasslands. However, the 12-month map is also suggesting that the conifers in the Sierras are also at risk.
Once again, we need to go beyond measuring reservoir levels and rainfall totals, and get to something that is appurtenant to the whole ecological foundations of California, like the percentage of mean stream flows for the fish, and the EMAP lines for the different native plant ecosystems.
We are already behind the 8-ball with our plant ecosystems in California, in that the native perennial grass understory was completely stripped off the desert in the late 1800s.
And in the rest of California below 3,000 ft. elevation, during two exceptional droughts between 1860 and 1940, we stripped off 99.99% of the perennial native grass with our sheep and cows, and the State has been replaced by flammable annual exotic grasses from Europe that turn brown in the summer and carry fire.
Before 1769, the whole State was green all summer, with very little burnable biomass, in the low growing native bunchgrasslands, equal to less than a couple of hay bales per acre.
So in spring 2009, when you have oak woodlands stressed to the point of only getting desert amounts of rain, and they are surrounded by flammable exotic grasses, that are equal to pouring 400 gallons of gasoline per acre (https://www.ecoseeds.com/flames.html), you can have a very rapid degradation within a whole ecosystem, caused by the drought-ecosystem-exotic plants-fire interplay.
This interplay has been experienced in the desert SW and the Great Basin for the last decade, as flammable exotics move in, and fires carried by the exotics during droughts, kill ecosystems on a massive scale.
Sincerely, Craig Dremann (650) 325-7333
Images generated by https://www.hprcc.unl.edu/maps/current/
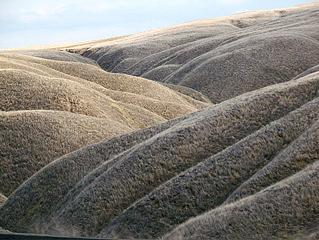
Kettleman Hills, May 2007.
West side of San Joaquin valley along
I-5, less than one inch of rainfall for the whole season, and
nothing grew that spring, when this area is normally a grassland
ecosystem. Photo copyright © 2007 by Craig Dremann.
What could be the causes of the California
drought, or, what are the large-scale symptoms?
Written to the Drought Monitor authors on
November 9, 2007:
Today's Land/sea temps and clouds, may
indicate new deserts?---
I've attached today's image from https://www.ssec.wisc.edu/data/comp/latest_cmoll.gif
and marked part of the west coast and the SE, as new desert, if
the weather patterns that have been forming, become permanent.
I am hoping that someone within NOAA is looking into these two drought-producing issues, and making up some computer models that include them?:
1.) WEAK WINTER "COMMAS" -- Winter-time (Oct.-May) Gulf of Alaska land and ocean temps. too warm, causing weak low pressure systems to form, that cannot sustain its shape to go as far south as San Diego.
Storm "commas" from the Gulf of Alaska by the time they hit Washington and Oregon, dissolve into weak fronts, that move from west to east, rather than slowly move parallel with the coast, and spinning off the coast dropping gentle rainfall every few days. Along with global warming, the formation of these weak fronts may be because of increase atmospheric aerosols from China and Japan.
New deserts could rapidly form within a few years, in California south of San Jose-Fresno-Tahoe line, Nevada, Utah, Idaho, Colorado, Arizona, New Mexico, northern Mexico and shut off maybe 60-80% of the southern Sierra and Colorado river watershed winter snowpack,
Could produce thousands of environmental refugees in northern Mexico that would be forced to migrate, when water supplies permanently decrease. Federal government who manages bulk of Cal. water supplies, will need to transfer a portion of the central valley farmland water, to supply need of California coastal cities.
The Fed. gov't has been quietly buying up water districts in the western San Joaquin valley in the last few years, like around the town of Alpaugh, to mitigate for the Friant dam, and restore the Endangered fish populations. The purchase and retirement of the whole western San Joaquin farmland districts from the San Luis reservoir south to Kern County, would probably produce enough water for the cities.
The whole wild-card in this issue, is how much will the Endangered fish require in California to survive and recover? The Delta smelt already has a legal right in court, and next in line will be the various Endangered salmon runs. There's already a suggestion that one-third of California's delta's water will be held back next spring for the smelt.
In the near future, new homes or business water hookups may be permanently frozen, in central and southern California, Las Vegas or Arizona, and the existing water hookups made appurtenant to the properties they currently serve. In order to build a new home or business, you will buy a property that already has a hookup, and tear down to build something new, like in the coastal towns of Bolinas and Cambria, CA.
Water should be permanently rationed for both cities and farmers, and new golf courses, flood field farming of crops like alfalfa and rice, should be eventually banned in California and Arizona.
2.) SUMMER MONSOONAL MOISTURE BLOCK - Summer-time (June-November) Indian monsoonal moisture to the USA blocked by hot, bare soil, mainly the Arabian peninsula, and also western India, Afghanistan, Iraq, Iran, Egypt, etc. Hot soil raises the dew point above which cloud can form, acting like a huge shut-off valve.
Good side of the summer moisture-block, is a very low rate of Atlantic hurricanes, but when moisture does get through, instead of being an intense compact storm like a hurricane, will probably be a big slug of moisture, and produce floods in the Texas to Iowa and Ohio valley area. Permanent "rain-shadow" may form over SE, and Atlanta may be in permanent drought and water restrictions mode, like the West.
An interesting side-show cause by the summer blockage, will be a permanent increase in flooding in India and Bangladesh, and tropical cyclones in the Arabian sea, like "Gonu" this summer, and "storm 5A" a weeks ago; and once the slugs of moisture get through the block, central Africa also gets slugs of flooding.
I'm hoping that NOAA is looking into these new, possibly permanent, US western and SE drought patterns with some computer modeling, looking into these possible upstream factors?
(Also see studies of the vegetation in relation to rainfall
in Arabia here)
Image generated by https://www.hpc.ncep.noaa.gov/
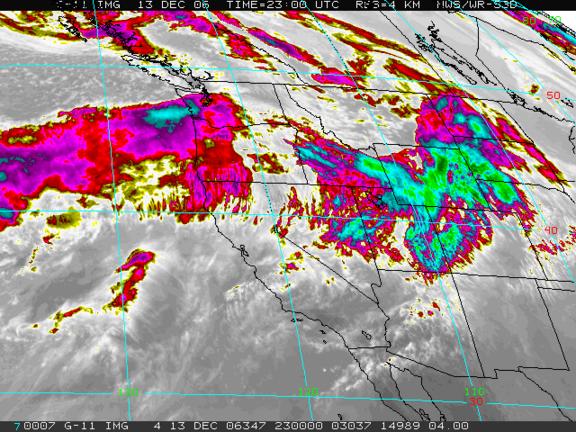
Clouds miss California in December 2006, one
of the "Pineapple Express" storms, moving from west
to east backed up by tropical moisture, instead of the "comma"
cold low coming from NW to SE parallel with the coast, from the
Gulf of Alaska to Southern California
Images from https://www.ssec.wisc.edu/data/comp/latest_cmoll.gif
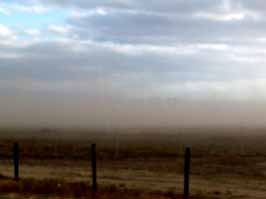
May, 2008, clouds of dust arrive in California
from China, forming
a layer on cars thick enough to sweep up. Instead of this airborne
dust being a local problem like the 1930s dust bowl, the Asian
dust is on a much more massive scale, on a global scale from the
Middle East through India and the Gobi desert of China.
The Asian desert storm dust clouds are also creating droughts
in India and China.
China dust off the coast of California, January 2009. This
dust cloud hit central California full-force on January 18-19,
lowering visibility to only 2-3 miles, and the dropping dust was
about 1/3 quartz sand from the Gobi desert, producing unhealthy
air quality. Photo copyright © 2009 by Sue Dremann.
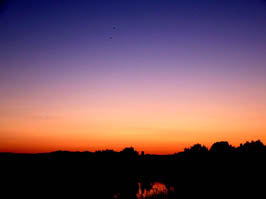
China dust mid-February, 2009
in Palo Alto, before sunrise © 2009 by
Craig Dremann.
NASA image of the Asian aerosols, going across the Pacific
to North America.
What is in this China dust cloud? A poster done by K.J. Moon et al, that can be downloaded
from airnow.gov, outlines the
following sources of the China dust cloud:
29.8% Asian dust (eg. Gobi desert sand)
18.1% Local soil from China
16.4% Burning biomass (Fields, wood fuel)
13.5% Coal combustion
7.1% Ferrous metal sources, iron
works
5.3% Sea salt
3.8% Municipal incineration!!-Yuk!
2.4% Diesel vehicles
1.7% Gasoline vehicles
At UC Davis, according to the John
Muir Institute of the Environment web site, Steve Cliff, researcher
in applied science, currently collects samples of particulate
matter (PM) from Mount Tamalpais, Donner Summit, and Mount Lassen.
His samples have revealed that dust from as far away as the Gobi
and Taklamakan Deserts of China and Mongolia and man-made pollution
from Asian cities reaches Northern California. The types of PM
that travel around the globe include soil dust, sulfate, soot,
and trace metals from coal burning, diesel, and other fossil fuel
combustion. Cliff is particularly interested in how this trans-Pacific
PM affects regional climate in California and how increasing PM
emissions in Asia will affect air quality in the US.
You can also read an article about this
China dust research, on the NOAA
Climate Program website
Also an important article in Atmos. Chem. Phys. Discuss., 9, 4013-4034, 2009 at https://www.atmos-chem-phys-discuss.net/9/4013/2009/ © Author(s) 2009. This work is distributed under the Creative Commons Attribution 3.0 License.
Trans-Pacific dust transport: integrated analysis of NASA/CALIPSO and a global aerosol transport model
K. Eguchi1, I. Uno2, K. Yumimoto2, T. Takemura2,
A. Shimizu3, N. Sugimoto3, and Z. Liu4
1=Department of Earth System Science and Tech., Kyushu University,
Fukuoka, Japan, 2=Research Institute for Applied Mechanics, Kyushu
University, Fukuoka, Japan, 3=National Institute for Environmental
Study, Tsukuba, Ibaraki, Japan, 4=National Institute of Aerospace,
Hampton,Virginia, USA
Abstract.
Detailed 3-D structures of Trans-Pacific Asian dust transport
occurring during 5-15 May 2007 were investigated using the NASA/CALIOP
vertical-resolved measurements and a three-dimensional aerosol
model (SPRINTARS).
Both CALIOP and SPRINTARS dust extinctions showed a good agreement
along the way of the transport from the dust source regions across
North Pacific into North America. A vertically two-layered dust
distribution was observed over the northeastern Pacific and North
America.
The lower dust layer originated from a dust storm generated in
the Gobi Desert on 5 May. It was transported at an altitude of
around 4 km MSL and has mixed with Asian anthropogenic air pollutants
during the course of transport.
The upper dust layer mainly originated from a dust storm that
occurred in the Taklimakan Desert 2-3 days after the Gobi dust
storm generation.
The upper dust cloud was transported in higher altitudes above
the major clouds layer during the Trans-Pacific transport. It
therefore has remained unmixed with the Asian air pollutants and
almost unaffected by wet removal.
The decay of its concentration level was small (only one-half
after its long-distance transport crossing the Pacific). Our dust
budget analysis revealed that the Asian dust flux passing through
the longitude plane of 140° E was 2.1 Tg, and one third of
that arrived North America.
The cases analyzed in this study revealed that, while the Gobi
Desert is an important source that can contribute to the long-range
dust transport, the Taklimakan Desert appears to be another important
source that can contribute to the dust transport occurring particularly
at high altitudes.
Download whole article as a 25 MB PDF file
"Hwangsa" is
the name in Korean, for the China dust cloud, according to the
paper presented at the American Geophysical Union, Fall Meeting
2008 by Drs. Choi, Kim and Lee.
They cited Park, Lee, Wang et al, and Husar et al, regarding the
origins of the cloud, "which is a typical example of mineral
dust aerosol, frequently occurs in the desert and loess plateau
in northern China and Mongolia during the spring season (SU
Park, EH Lee. 2004 - Parameterization of Asian dust (Hwangsa)
particle-size distributions for use in dust emission models. Atmospheric
Environment).
"In particular, they mainly originate from the arid area above 1500m from sea level (Z Wang, H Ueda, M Huang. 2000. A deflation module for use in modeling long-range transport of yellow sand over East Asia - Journal of Geophysical Research-Atmospheres) and some of them affect to North Pacific Ocean and North America RB Husar, DM Tratt, B Schichtel, SR Falke, F Li, D et al. 2001. Asian dust events of April 1998. Journal of Geophysical Research). "
The China dust storm is a well-known springtime meteorological phenomenon throughout east Asia; so much so, that it has a name: "Huangsha" in China, "Whangsa" in Korea, and "Kosa" in Japan, according to the Husar et al, 2001 article.
Another article at
Science News -
Aerosol Pollution Slows Down Winds And Reduces Rainfall.
ScienceDaily (Jan. 23, 2007)
DOWNLOAD a movie, showing the clouds
of China dust in the first week of
May, 2008, hitting the west coast of the United States. This dust,
along with the airborne carbon and sulfur dioxides, disrupting
the flow of winter and spring rainfall to California?:
Description of this China dust cloud GIF movie: an animated gif that shows the RAQMS analyzed dust mass mixing ratio (shaded, nano-gram/gram) on the 280K potential temperature (isentrop) surface for May 01-11, 2008. [This model assimilates satellite and other data.] The 280K isentrop [surface] slopes northward with altitude and intersects the surface at the thick white line. The pressure of the isentrop is indicated by the thin white lines.
The RAQMS analysis
indicates that the elevated dust observed in SF on May 8-9 is
indeed from trans-pacific transport and is first evident on the
280K isentrop over the Aleutian Islands on the 5th of May. Note
that gravitational settling of the dust particles results in slow
descent of the dust plume as it moves across the Pacific, which
accounts for the increases in dust mass as the plume reaches SF.
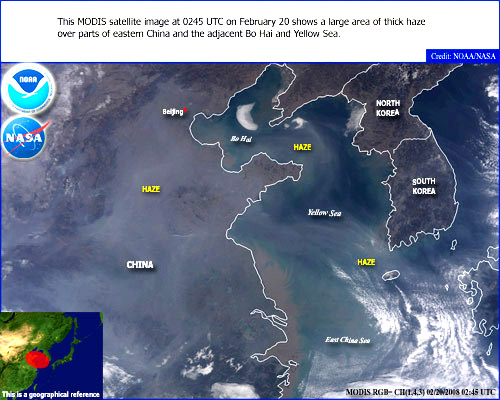
China dust storms, hitting the San Francisco
Bay area,
dates and images below:
|
|
|
|
|
|
|
|
|
|
|
|
|
|
|
|
|
|
|
|
|
|
|
|
|
|
|
|
|
|
|
|
|
|
|
|
|
|
|
|
|
|
May 9, 2008
May 25, 2008
March 24, 2009
NASA TOP STORY May 15 2003:
Elvia H. Thompson Headquarters, Washington (Phone: 202-358-1696)
Rob Gutro, Goddard Space Flight Center Greenbelt, Md. (Phone: 301-286-4044)
NASA funded scientists, using an atmospheric computer model, proved for the first time dust from China's TaklaMakan desert traveled more than 12,400 miles (20,000 kilometers) over two weeks and landed on the French Alps. Chinese dust plumes have reached North America and Greenland, but had not been reported in Europe.
The findings are highlighted in a paper authored by Francis E. Grousset of the Lamont-Doherty Earth Observatory of Columbia University (LDEOCU), Palisades, N.Y., and Université Bordeaux, France; Aloys Bory and Pierre E. Biscaye, also of LDEOCU; and Paul Ginoux, University of Maryland, Baltimore County (UMBC) and NASA's Goddard Space Flight Center (GSFC), Greenbelt, Md. The study appeared in a recent issue of the American Geophysical Union's Geophysical Research Letters.
This study looked at dust that traveled from February 25 to March 7, 1990. "The dust particles traveled around the world in about two weeks, and along their journey, crossed China, the North Pacific, North America and the North Atlantic Ocean," Ginoux said.
Research conducted in 1994 showed, over the 20 years prior, a score of red dust events coated the snow cover in the French Alps and Pyrénées mountains. The red dust topping these European mountain ranges was sampled and stored in bags for comparison with dust from other parts of the world. Scientists analyze the minerals and compositions of certain distinctive elements (isotopes) of the dust to identify its origin. Information about the origins and final locations of dust are important to help determine any effects from heavy metal, fungal, bacterial and viral distribution that may be associated with it.
Ginoux and his colleagues used NASA technology and support in their research. Meteorological information, such as wind speed and direction, precipitation, air pressure, and temperature, were put into a computer model. The model recreated how the atmosphere moved as the dust traveled from China to the Alps. The meteorological information was from GSFC's Earth Observing System Data Assimilation System.
Several computer models, simulating the movement of dust in the atmosphere, were used to track its journey in this study. The Global Ozone Chemistry Aerosol Radiation Transport computer model, largely funded by NASA, uses the winds, soil moisture, and surface characteristics to simulate dust generation and transport. The National Oceanic and Atmospheric Administration's (NOAA) Air Resources Laboratory (ARL), provided models showing the paths of air masses, as they moved around the world, from the time the dust was swept into the atmosphere to when it settled on the Alps.
ARL can project where air pollution will move based on meteorological conditions. NOAA's National Weather Service National Center for Environmental Prediction re-analyzed global meteorological conditions and plotted the dust movement to verify the computer models.
This research was funded by France's National Center for Scientific
Research, NASA's Earth Science Enterprise (ESE), and the National
Science Foundation. NASA's ESE is dedicated to understanding the
Earth as an integrated system and applying Earth System Science
to improve prediction of climate, weather and natural hazards
using the unique vantage point of space.
Dremann's suggested drought maps, the
2009 maps based on USGS stream flow data: See suggested maps, 2006-2009
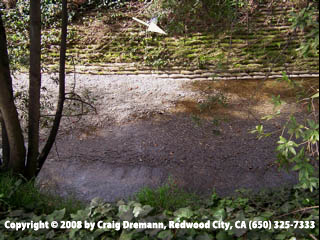
Palo Alto's San Francisquito Creek,
the USGS 68-year streamflow data used to produce a daily measured
effect on the ecosystem by the daily rainfall, with 200 points
for the whole rainfall year, and when rainfall/streamflow is missing,
minus points. Arrow shows normal stream level for the photos date,
March 2, 2008. The total annual normal precipitation for the area
is 20 inches. Until mid-February 2009, this stretch was dry all
winter, to the gravel and then dried out to the gravel again by
late February.
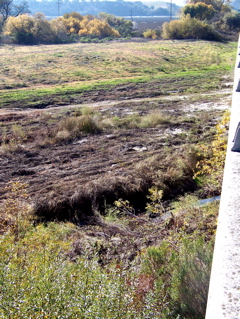
January 1, 2009, the Salinas river dry to the rocks, at Spreckels,
at the Cal. Highway 68 bridge, and by mid-January the river had
dried upstream to the town of Solidad. This is the location of
the USGS gauge, on the other side of the bridge:
SPRECKELS, CALIFORNIA, SALINAS RIVER GAUGE
LOCATION.--Lat 36°37'52", long 121°40'17"
referenced to North American Datum of 1927, Monterey County, CA,
Hydrologic Unit 18060005, in National Grant, on right bank, on
downstream side of bridge on Salinas-Monterey Highway (68), 0.8
mi upstream from El Toro Creek, 1.6 mi northwest of Spreckels,
and 2 mi south of Salinas.
DRAINAGE AREA.--4,156 mi2.
PERIOD OF RECORD.--January 1900 to August 1901, October 1929 to
current year. Records for water year 1930 incomplete; yearly estimate
published in WSP 1315-B. Published as "near Salinas"
1900-1901.
GAGE.--Water-stage recorder and crest-stage gage. Datum of gage
is 20.56 ft above NGVD of 1929. 1900-1901, May 10 to July 29,
1940, nonrecording gages at site 0.3 mi downstream at different
datum. July 29, 1940, to May 22, 1969, water-stage recorder at
site 0.3 mi downstream at datum 0.69 ft lower. May 23, 1969, to
Jan. 13, 1970, nonrecording gage at same site and datum. Mar.
17, 1941, to June 30, 1961, supplementary nonrecording gages.
REMARKS.--Flow regulated by Santa Margarita Lake (formerly Salinas
Reservoir) beginning in 1941, usable capacity, 23,000 acre-ft;
Lake Nacimiento (formerly Nacimiento Reservoir) beginning in February
1957, usable capacity, 340,000 acre-ft; and by Lake San Antonio
beginning in December 1965, usable capacity, 330,000 acre-ft.
Large withdrawals from ground water and small surface-water diversions
for municipal use and for irrigation
upstream from station. See schematic diagram of Salinas River
Basin available from the California Water Science Center.
EXTREMES FOR PERIOD OF RECORD.--Maximum discharge, 95,000 ft3/s,
Mar. 12, 1995, gage height, 30.29 ft, from rating extended above
30,000 ft3/s, peak includes estimate of 9,800 ft3/s bypassing
gage; no flow at times in 1929-40, many days each year since 1990.
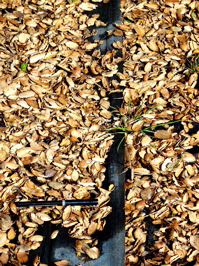
The normally evergreen native California live oaks (Quercus agrifolia)
shedding their leaves during the drought, January 2009.Photos
by C. Dremann
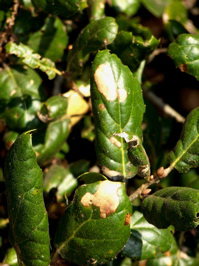
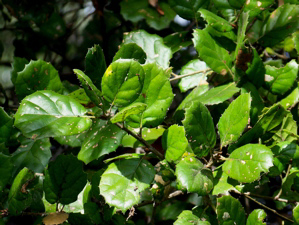 January 2009, the evergreen native
oak leaves on the left, showing the impact of the drought on their
leaves, tightly rolled to save water, and centers of living leaves
dying. Leaves are normally flatter, in winter, like the photo
on the right. Photos by C. Dremann
January 2009, the evergreen native
oak leaves on the left, showing the impact of the drought on their
leaves, tightly rolled to save water, and centers of living leaves
dying. Leaves are normally flatter, in winter, like the photo
on the right. Photos by C. Dremann
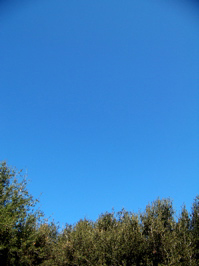
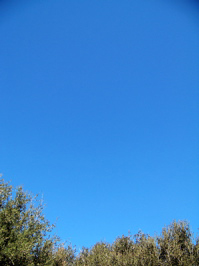
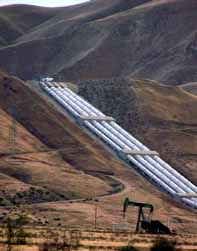 The TWO LIQUIDS ...that keep California functioning. Photo Kern county, the California Aqueduct water
getting pumped over the Tehachapi mountains, on its way to southern
California, and oil well in foreground, and the water is
being pumped from electricity produced by fossil fuels, by Craig
Dremann.
The TWO LIQUIDS ...that keep California functioning. Photo Kern county, the California Aqueduct water
getting pumped over the Tehachapi mountains, on its way to southern
California, and oil well in foreground, and the water is
being pumped from electricity produced by fossil fuels, by Craig
Dremann.
Updated December 20, 2022 - Go to The
Reveg Edge website
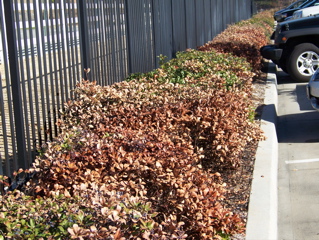
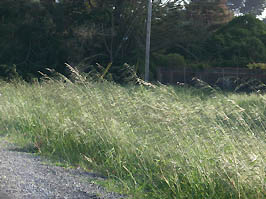